How to trade currencies as a supply and demand trader as banks do
Hi, Readers.
I hope you all are enjoying your trading as Usd/cad really giving us more than what we first anticipated & now it turns of the U.S dollars bulls to final lay down.
Let’s putting the trade & setups Aside & talk about the potential to grow your trading skills. I’ve been asked numerous time that How I manage to get that much out of my trading with just 10-15 pips stop & Riding the reversals and continuation of trend.
So, In order to answer this, I would like to reply with just one ‘quote’ which is experience & know what is happening on the chart. You ever realize trading a 5 minute chart with ticks & getting 10-20 pips in session is what banks do in order to liquidate market.
So, If you don’t believe one thing which is how does the market move that much in ‘Active’ Trading hours. That is what banks and institutions been doing all the time. If they never participate in trading then Market might keep moving in another direction,unless and untill there are opposite orders & this happens everyday.
Now the Question Here Arise is :-
How does banks, institutions, hedge funds & other Financial Institutions trade
That’s truly the reason to believe that how does large institutions, banks and other financial institutions trade & Why can’t they trade against each other and try to be on top. Let’s make one thing clear which is that they trade in one direction & never do participate at once as there are always one at the top & left clues on the chart where it would leave & when there is enough orders to liquidate and re-enter before continuation or reversals.
If you want to know how they do, then bookmark this post & keep looking everyday for next one month to see If there is something of ‘Value’, you get to know and we should start with a chart of Gbp/nzd & usd/chf today when U.S market close.
First of all, I would look into the Usd/chf Chart, where I will point out three back to back trading opportunity and forth one around these levels from 0.9870 -0.9950 & when this will happen, I would be first one to update the chart. All these opportunities were sell big time, either it was pending sell orders or retest with strong conviction & compression to revisit demand again.
First of all , look at the left shoulder Area, It could be Drop base really after engulf & Could be QM level special when a strong break followed by failed retest Level.
2. Whenever you see failed Retest level look to tighten your screws & always look for approach & lined up trade on any time frame.
3. Most Important point to note here is, It could be a strong historical level turned into Left Should of ‘head & shoulder’ family where Banks & institutions have pending orders before next move to the source or target.
4. Next level to watch out for is (If it is a Dbr after engulf, low of base level If at all there is a trick played there. Suppose if high or left of the shoulder is way to strong level to approach , If the move after break and retest is very strong, then probably base of that level is test with conviction and a new Flag is created below that level.
5. I would should you all these steps level by level & Surely that study is going to continue for months to come & You should not miss it as couple of months will entirely change the way you trade & way should be trading in the next months & years to come.
Price Action follows a structure of broken & Retest Approach which is a sign of Weakness or strength when Approached
Price Action only tell us who is king & who is dominating the market . Bulls or Bears who have the edge .
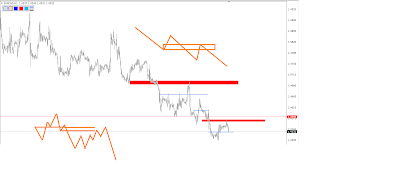
No one can ever tell prior to move that who will dominate the market but structure is one good predominant clue of what market is above to do when approach. e.g Price following a structure of broken support and retest in the following chart.
But when last support was broken , banks plays a trick of failed retest and create a panic area which is so called ‘Left shoulder’ as mark with the blue line.
Market created a random fakeout after testing and failed at previous demand but market does not have enough force to retest the broken level again. So, it create a flag Just below the left should and engulf the drop base rally with conviction which was good enough to look out for opportunity to sell again at the left shoulder.
This structure is the easiest piece of Pie you can ever have. Market found structures failed rallies, Drop base drop & Candlesticks Traps after one another. But only most of them fail but those which works does not move an point or two higher when exactly predicted.
Stay tuned for another Chart Example & probably this one would be a live Trade .


